Freshness Assertions
The Freshness Assertions feature is available as part of the Acryl Observe module of DataHub Cloud. If you are interested in learning more about Acryl Observe or trying it out, please visit our website.
Introduction
Can you remember a time when a Data Warehouse Table that you depended on went days, weeks, or even months without being updated with fresh data?
Perhaps a bug had been introduced into an upstream Airflow DAG or worse, the person in charge of maintaining the Table has departed from your organization entirely. There are many reasons why an important Table on Snowflake, Redshift, BigQuery, or Databricks may fail to be updated as often as expected.
What if you could reduce the time to detect these incidents, so that the people responsible for the data were made aware of data issues before anyone else? What if you could communicate commitments about the freshness or change frequency of a table? With DataHub Cloud Freshness Assertions, you can.
DataHub Cloud allows users to define expectations about when a particular Table in the warehouse should change, and then monitor those expectations over time, with the ability to be notified when things go wrong.
In this article, we'll cover the basics of monitoring Freshness Assertions - what they are, how to configure them, and more - so that you and your team can start building trust in your most important data assets.
Let's get started!
Support
Freshness Assertions are currently supported for:
- Snowflake
- Redshift
- BigQuery
- Databricks
- DataHub Operations (collected via ingestion)
Note that an Ingestion Source must be configured with the data platform of your choice in DataHub Cloud's Ingestion tab.
Note that Freshness Assertions are not yet supported if you are connecting to your warehouse using the DataHub CLI.
What is a Freshness Assertion?
A Freshness Assertion is a configurable Data Quality rule used to determine whether a Table on the Data Warehouse has been updated within a given period of time. Freshness Assertions are particularly useful when you have frequently-changing Tables.
For example, imagine that we work for a company with a Snowflake Table that stores user clicks collected from our e-commerce website. This table is updated with new data on a specific cadence: once per hour (In practice, daily or even weekly are also common). In turn, there is a downstream Business Analytics Dashboard in Looker that shows important metrics like the number of people clicking our "Daily Sale" banners, and this dashboard is generated from data stored in our "clicks" table. It is important that our clicks Table continues to be updated each hour because if it stops being updated, it could mean that our downstream metrics dashboard becomes incorrect. And the risk of this situation is obvious: our organization may make bad decisions based on incomplete information.
In such cases, we can use a Freshness Assertion that checks whether the Snowflake "clicks" Table is being updated with fresh data each and every hour as expected. If an hour goes by without any changes, we can immediately notify our team, to prevent any negative impacts.
Anatomy of a Freshness Assertion
At the most basic level, Freshness Assertions consist of a few important parts:
- An Evaluation Schedule
- A Change Window
- A Change Source
In this section, we'll give an overview of each.
1. Evaluation Schedule
The Evaluation Schedule: This defines how often to check a given warehouse Table for new updates. This should usually be configured to match the expected change frequency of the Table, although is can also be more frequently. If the Table changes daily, it should be daily. If it changes hourly, it should be hourly. You can also specify specific days of the week, hours in the day, or even minutes in an hour.
2. Change Window
The Change Window: This defines the window of time that is used when determining whether a change has been made to a Table. We can either check for change to the Table
Since the freshness check was last evaluated. For example, if the evaluation schedule is set to run every day at 8am PST, we can check whether a change was made between the previous day at 8am and the following day at 8am.
Within a specific amount of time of the freshness check being evaluated (A fixed interval). For example, if the evaluation schedule is set to run every day at 8am PST, we can check whether a change was made in the 8 hours before the check is evaluated, which would mean in the time between midnight (12:00am) and 8:00am PST.
3. Change Source
The Change Source: This is the mechanism that DataHub Cloud should use to determine whether the Table has changed. The supported Change Source types vary by the platform, but generally fall into these categories:
Audit Log (Default): A metadata API or Table that is exposed by the Data Warehouse which contains captures information about the operations that have been performed to each Table. It is usually efficient to check, but some useful operations are not fully supported across all major Warehouse platforms. Note that for Databricks, this option is only available for tables stored in Delta format.
Information Schema: A system Table that is exposed by the Data Warehouse which contains live information about the Databases and Tables stored inside the Data Warehouse. It is usually efficient to check, but lacks detailed information about the type of change that was last made to a specific table (e.g. the operation itself - INSERT, UPDATE, DELETE, number of impacted rows, etc). Note that for Databricks, this option is only available for tables stored in Delta format.
Last Modified Column: A Date or Timestamp column that represents the last time that a specific row was touched or updated. Adding a Last Modified Column to each warehouse Table is a pattern is often used for existing use cases around change management. If this change source is used, a query will be issued to the Table to search for rows that have been modified within a specific window of time (based on the Change Window)
High Watermark Column: A column that contains a constantly-incrementing value - a date, a time, or another always-increasing number. If this change source is used, a query will be issued to the Table to look for rows with a new "high watermark", e.g. a value that is higher than the previously observed value, in order to determine whether the Table has been changed within a given period of time. Note that this approach is only supported if the Change Window does not use a fixed interval.
DataHub Operation: A DataHub "Operation" aspect contains timeseries information used to describe changes made to an entity. Using this option avoids contacting your data platform, and instead uses the DataHub Operation metadata to evaluate Freshness Assertions. This relies on Operations being reported to DataHub, either via ingestion or via use of the DataHub APIs (see Report Operation via API). Note if you have not configured an ingestion source through DataHub, then this may be the only option available. By default, any operation type found will be considered a valid change. Use the Operation Types dropdown when selecting this option to specify which operation types should be considered valid changes. You may choose from one of DataHub's standard Operation Types, or specify a "Custom" Operation Type by typing in the name of the Operation Type.
File Metadata (Databricks Only): A column that is exposed by Databricks for both Unity Catalog and Hive Metastore based tables which includes information about the last time that a file for the table was changed. Read more about it here.
Using either of the column value approaches (Last Modified Column or High Watermark Column) to determine whether a Table has changed can be useful because it can be customized to determine whether specific types of changes have been made to a given Table. And because this type of assertion does not involve system warehouse tables, they are easily portable across Data Warehouse and Data Lake providers.
Freshness Assertions also have an off switch: they can be started or stopped at any time with the click of button.
Creating a Freshness Assertion
Prerequisites
- Permissions: To create or delete Freshness Assertions for a specific entity on DataHub, you'll need to be granted the
Edit AssertionsandEdit Monitorsprivileges for the entity. This will be granted to Entity owners as part of theAsset Owners - Metadata Policyby default. - (Optional) Data Platform Connection: In order to create a Freshness Assertion that queries the source data platform directly (instead of DataHub metadata), you'll need to have an Ingestion Source configured to your Data Platform: Snowflake, BigQuery, or Redshift under the Integrations tab.
Once these are in place, you're ready to create your Freshness Assertions!
Steps
- Navigate to the Table that to monitor for freshness
- Click the Validations tab
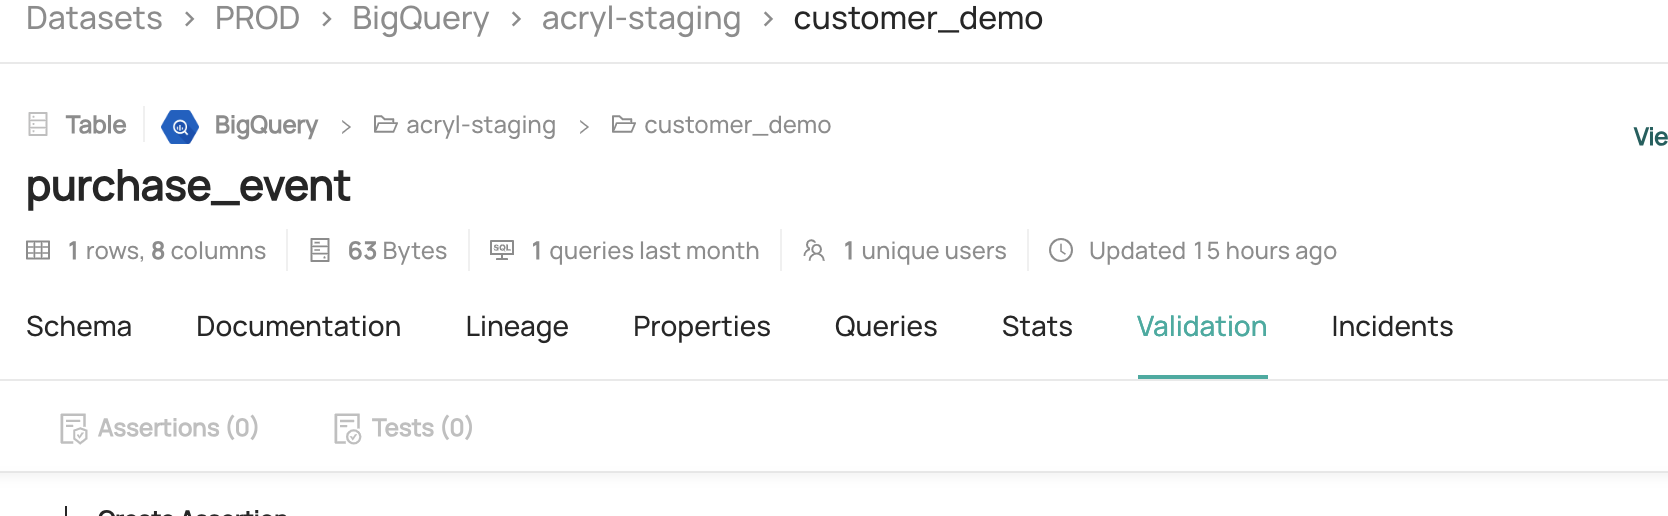
- Click + Create Assertion
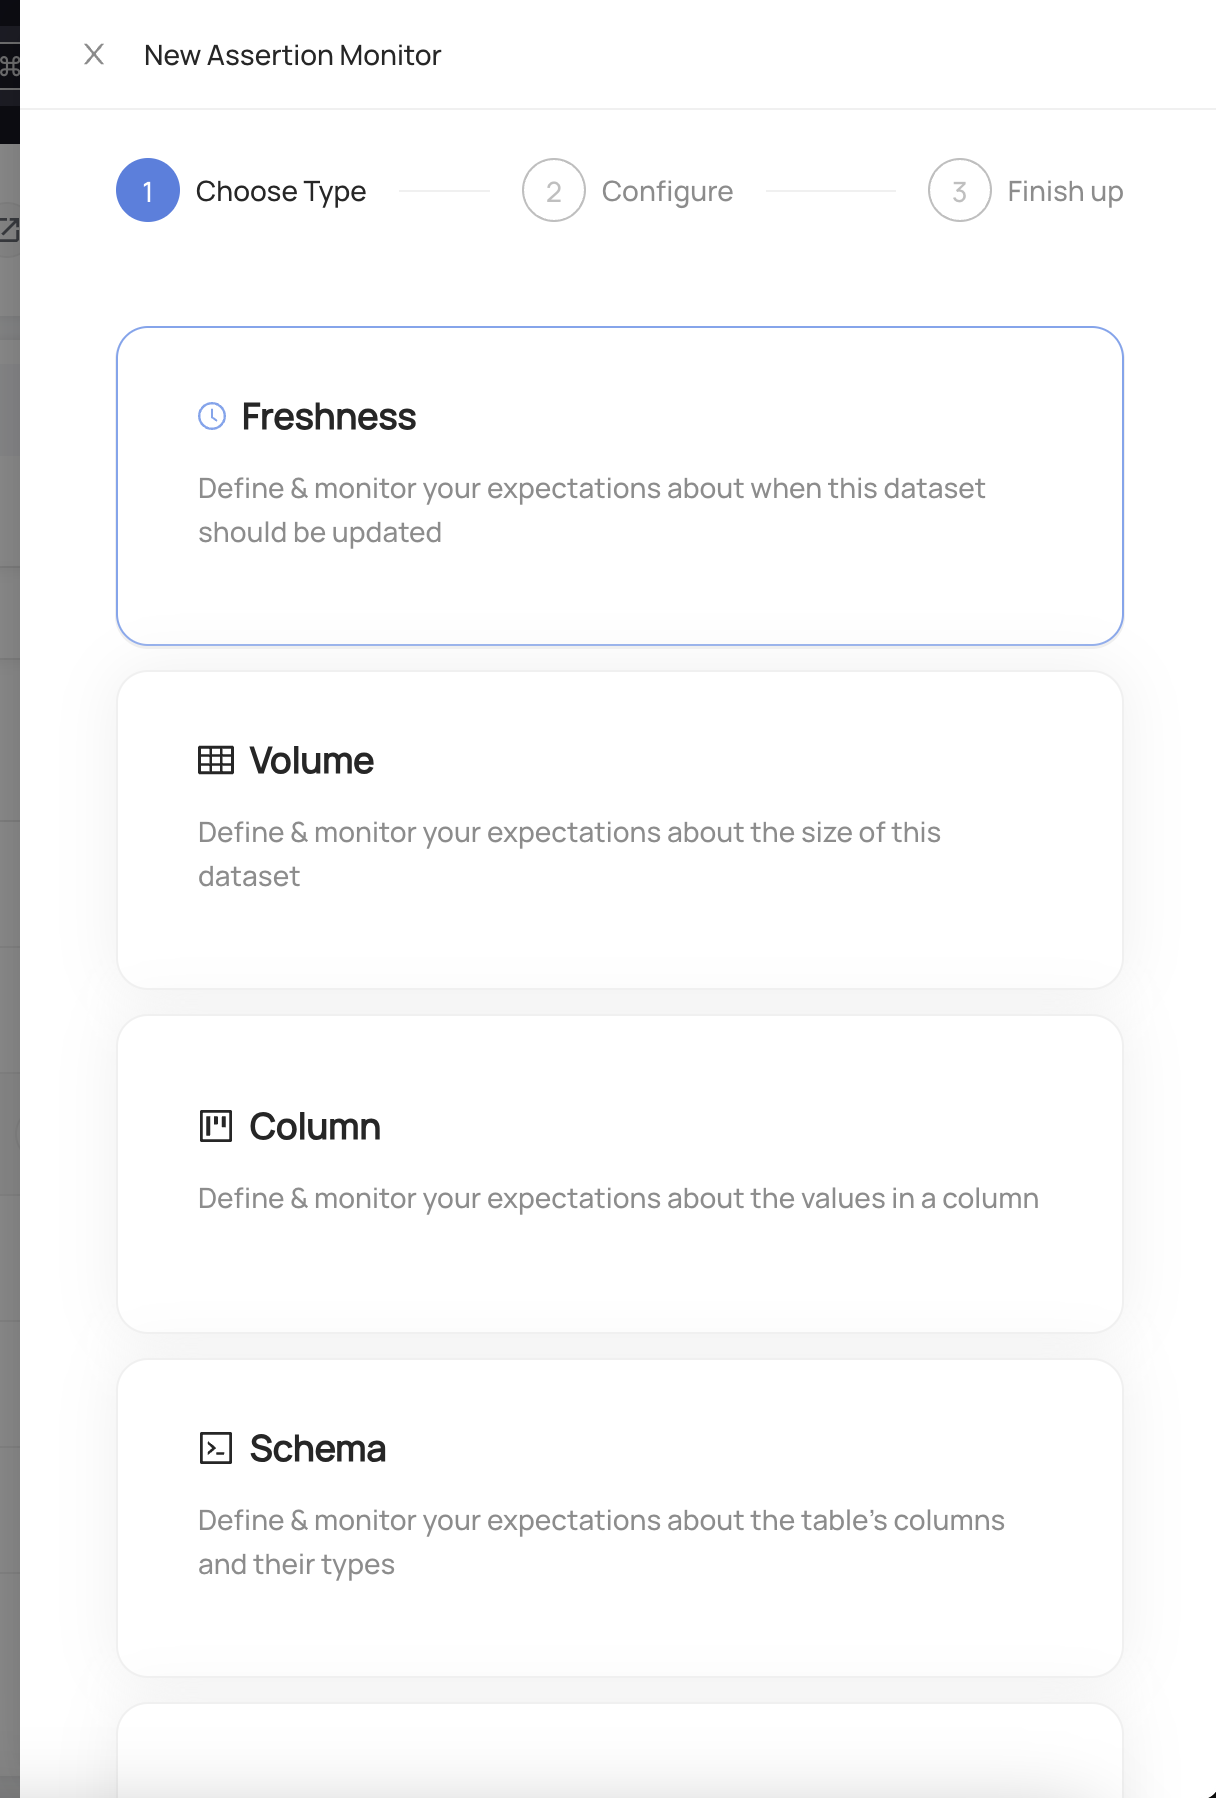
Choose Freshness
Configure the evaluation schedule. This is the frequency that the table will be checked for changes. This represents you expectation about the frequency at which the table should be updated.
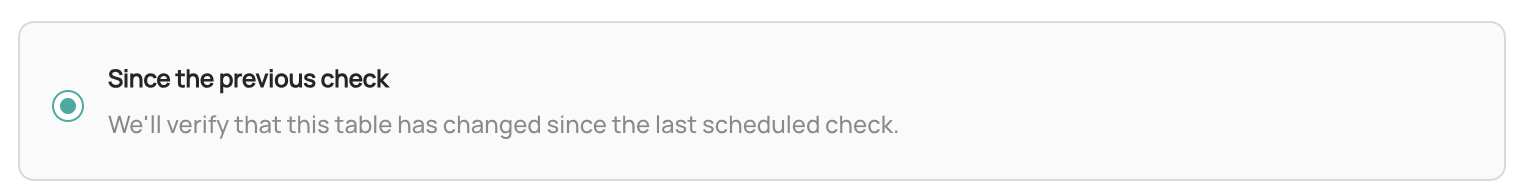
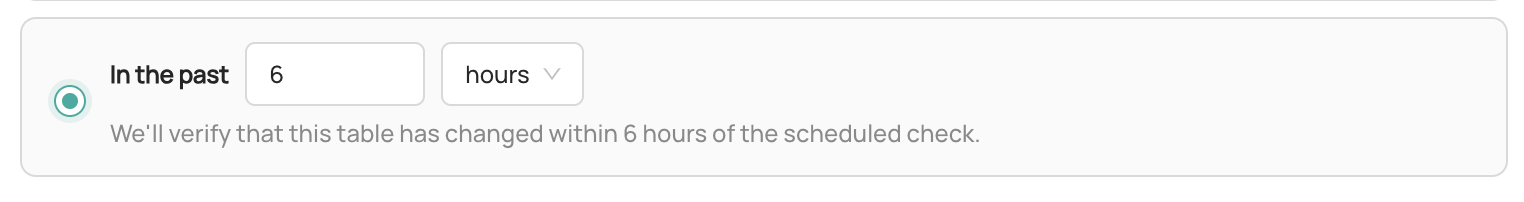
Configure the evaluation period. This defines the period of time that will be considered when looking for changes to the table. Choose between Since the previous check to check whether the table has changed since the past evaluation, or In the past X hours to configure a fixed interval that is used when checking the table.
Check whether the table has changed between subsequent evaluations of the check
Check whether the table has changed in a specific window of time
- (Optional) Click Advanced to customize the evaluation source. This is the mechanism that will be used to evaluate the check. Each Data Platform supports different options including Audit Log, Information Schema, Last Modified Column, High Watermark Column, and DataHub Operation.
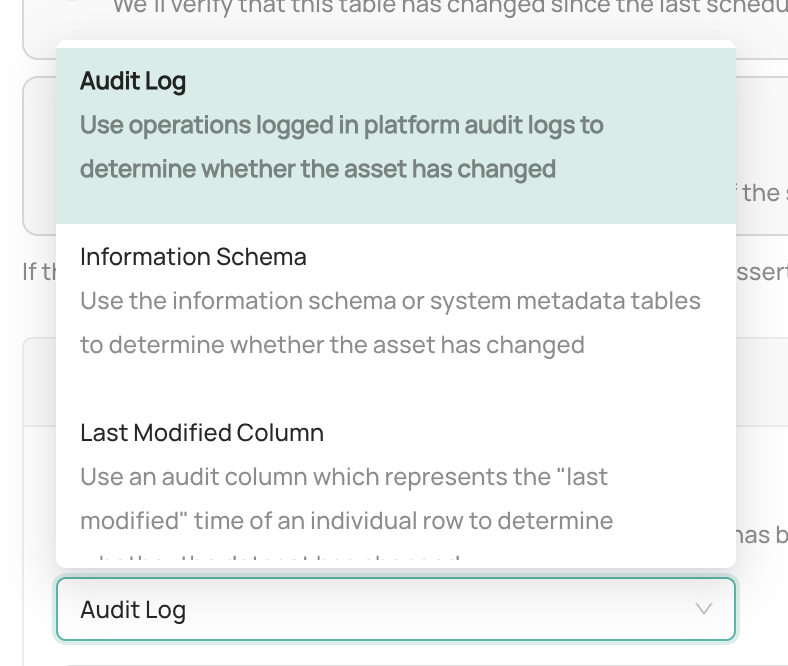
- Audit Log: Check the Data Platform operational audit log to determine whether the table changed within the evaluation period.
- Information Schema: Check the Data Platform system metadata tables to determine whether the table changed within the evaluation period.
- Last Modified Column: Check for the presence of rows using a "Last Modified Time" column, which should reflect the time at which a given row was last changed in the table, to determine whether the table changed within the evaluation period.
- High Watermark Column: Monitor changes to a continuously-increasing "high watermark" column value to determine whether a table has been changed. This option is particularly useful for tables that grow consistently with time, for example fact or event (e.g. click-stream) tables. It is not available when using a fixed lookback period.
- DataHub Operation: Use DataHub Operations to determine whether the table changed within the evaluation period.
- Configure actions that should be taken when the Freshness Assertion passes or fails
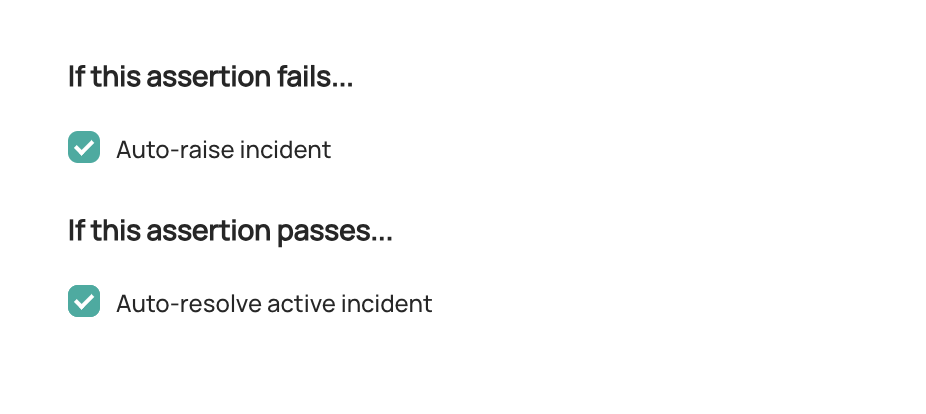
Raise incident: Automatically raise a new DataHub
FreshnessIncident for the Table whenever the Freshness Assertion is failing. This may indicate that the Table is unfit for consumption. Configure Slack Notifications under Settings to be notified when an incident is created due to an Assertion failure.Resolve incident: Automatically resolved any incidents that were raised due to failures in this Freshness Assertion. Note that any other incidents will not be impacted.
Click Next and add a description.
Click Save.
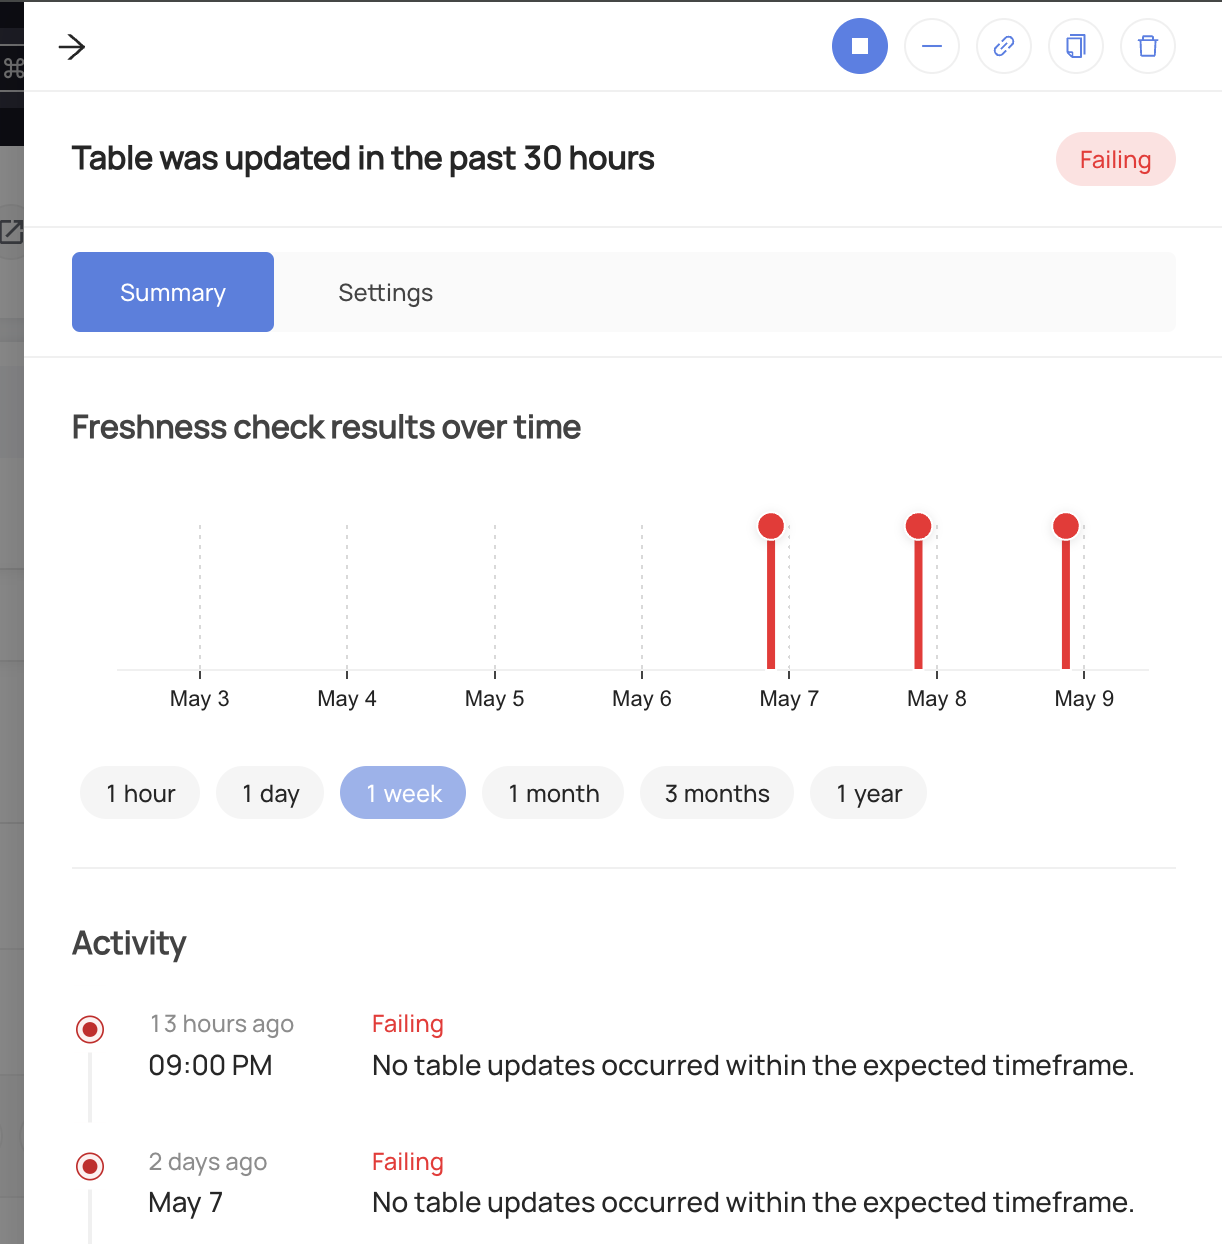
And that's it! DataHub will now begin to monitor your Freshness Assertion for the table.
Once your assertion has run, you will begin to see Success or Failure status for the Table
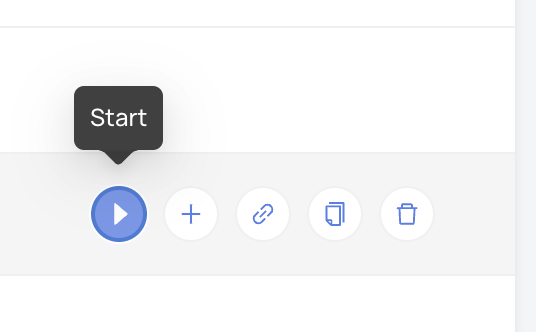
Stopping a Freshness Assertion
In order to temporarily stop the evaluation of the assertion:
- Navigate to the Validations tab of the Table with the assertion
- Click Freshness to open the Freshness Assertion assertions
- Click the "Stop" button for the assertion you wish to pause.
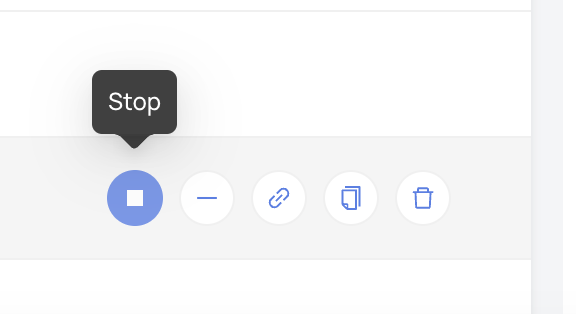
To resume the assertion, simply click Start.
Smart Assertions ⚡
As part of the Acryl Observe module, DataHub Cloud also provides Smart Assertions out of the box. These are dynamic, AI-powered Freshness Assertions that you can use to monitor the freshness of important warehouse Tables, without requiring any manual setup.
If DataHub Cloud is able to detect a pattern in the change frequency of a Snowflake, Redshift, BigQuery, or Databricks Table, you'll find
a recommended Smart Assertion under the Validations tab on the Table profile page:
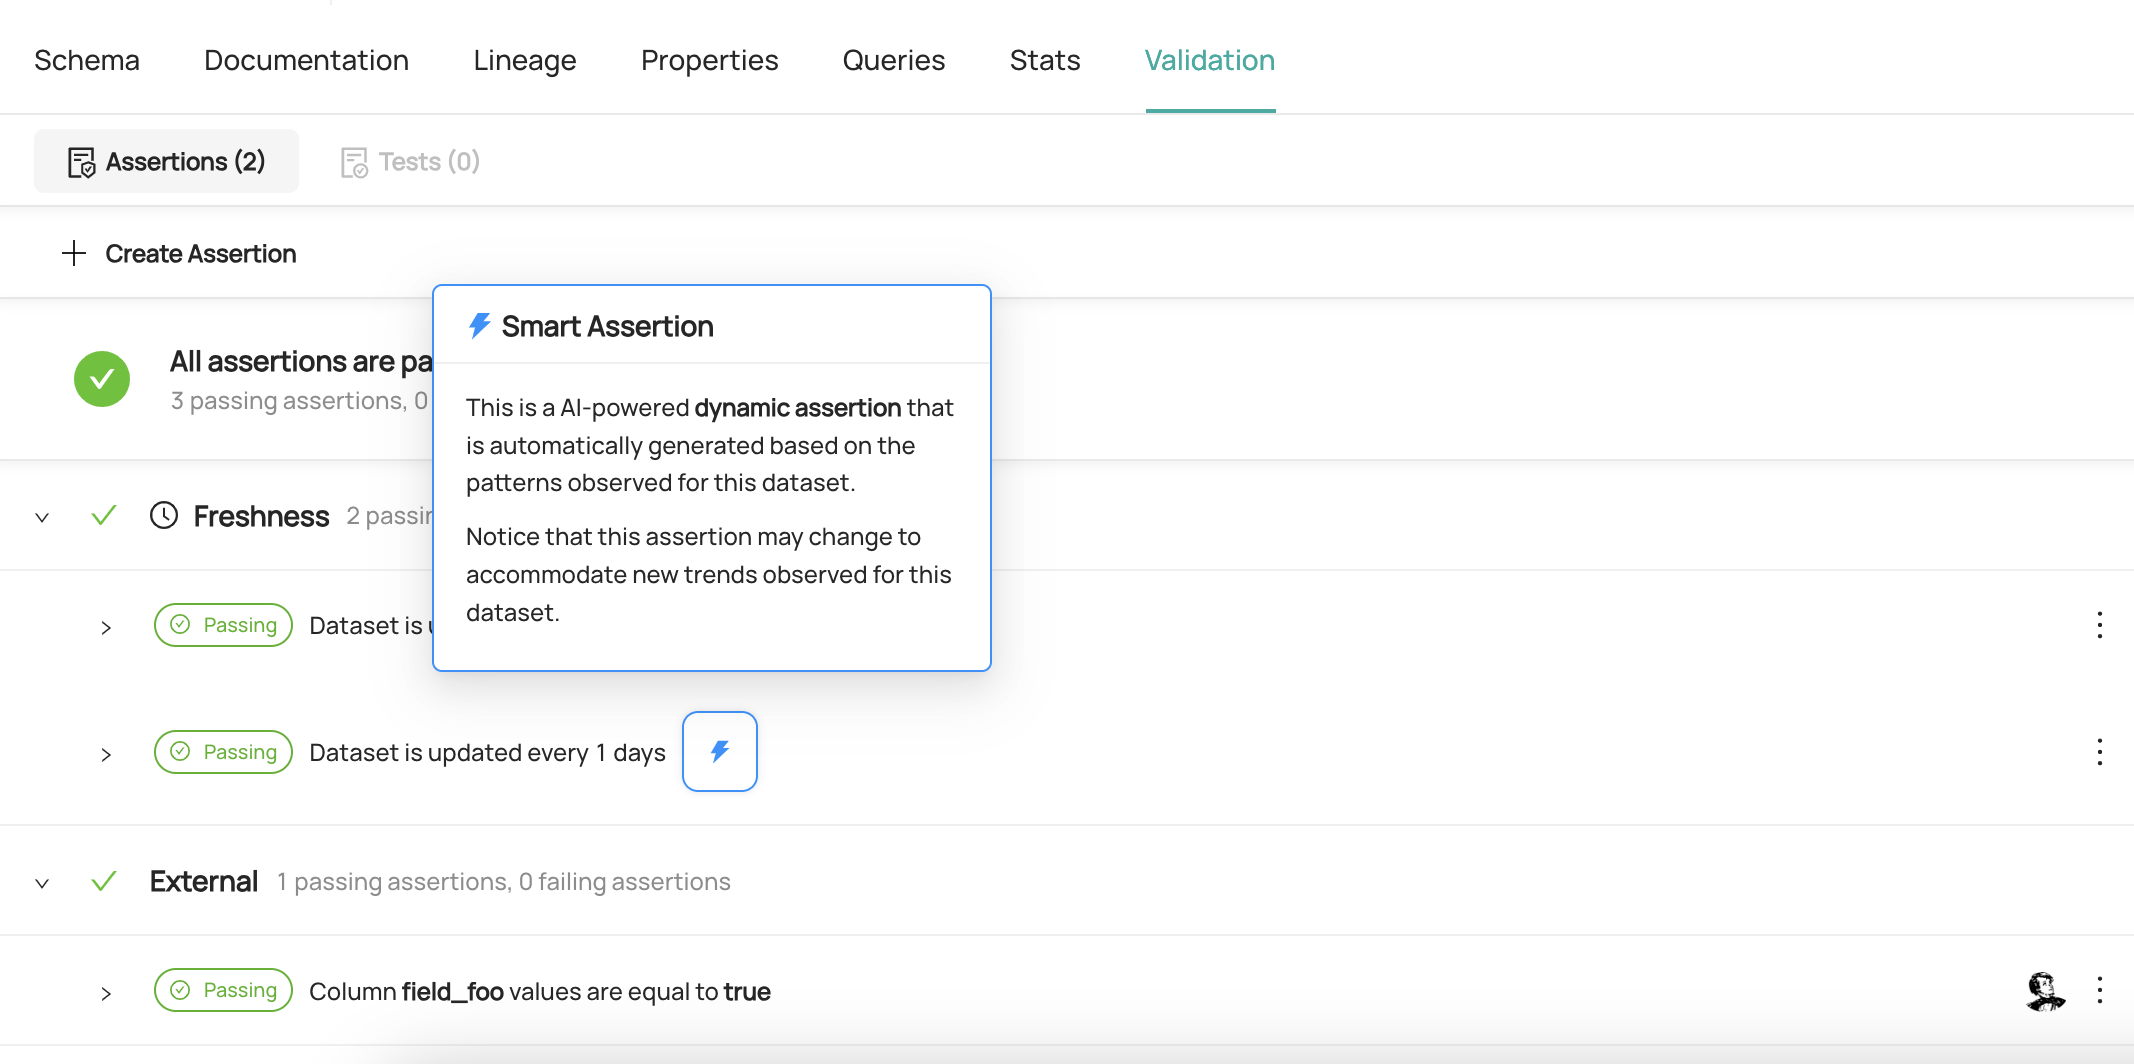
In order to enable it, simply click Turn On. From this point forward, the Smart Assertion will check for changes on a cadence based on the Table history, by default using the Audit Log.
Don't need it anymore? Smart Assertions can just as easily be turned off by clicking the three-dot "more" button and then Stop.
Creating Freshness Assertions via API
Under the hood, DataHub Cloud implements Freshness Assertion Monitoring using two concepts:
- Assertion: The specific expectation for freshness, e.g. "The table was changed int the past 7 hours" or "The table is changed on a schedule of every day by 8am". This is the "what".
- Monitor: The process responsible for evaluating the Assertion on a given evaluation schedule and using specific mechanisms. This is the "how".
Note that to create or delete Assertions and Monitors for a specific entity on DataHub, you'll need the
Edit Assertions and Edit Monitors privileges for it.
GraphQL
In order to create or update a Freshness Assertion, you can use the upsertDatasetFreshnessAssertionMonitor mutation.
Examples
To create a Freshness Assertion Entity that checks whether a table has been updated in the past 8, and runs every 8 hours:
mutation upsertDatasetFreshnessAssertionMonitor {
  upsertDatasetFreshnessAssertionMonitor(
    input: {
      entityUrn: "<urn of entity being monitored>",
      schedule: {
        type: FIXED_INTERVAL,
        fixedInterval: { unit: HOUR, multiple: 8 }
      }
      evaluationSchedule: {
        timezone: "America/Los_Angeles",
        cron: "0 */8 * * *"
      }
      evaluationParameters: {
        sourceType: INFORMATION_SCHEMA
      }
      mode: ACTIVE
    }
  ) {
    urn
  }
}
You can use same endpoint with assertion urn input to update an existing Freshness Assertion and corresponding Monitor:
mutation upsertDatasetFreshnessAssertionMonitor {
  upsertDatasetFreshnessAssertionMonitor(
    assertionUrn: "<urn of assertion created in earlier query>"
    input: {
      entityUrn: "<urn of entity being monitored>",
      schedule: {
        type: FIXED_INTERVAL,
        fixedInterval: { unit: HOUR, multiple: 6 }
      }
      evaluationSchedule: {
        timezone: "America/Los_Angeles",
        cron: "0 */6 * * *"
      }
      evaluationParameters: {
        sourceType: INFORMATION_SCHEMA
      }
      mode: ACTIVE
    }
  ) {
    urn
  }
}
You can delete assertions along with their monitors using GraphQL mutations: deleteAssertion and deleteMonitor.
Reporting Operations via API
DataHub Operations can be used to capture changes made to entities. This is useful for cases where the underlying data platform does not provide a mechanism
to capture changes, or where the data platform's mechanism is not reliable. In order to report an operation, you can use the reportOperation GraphQL mutation.
Examples
mutation reportOperation {
  reportOperation(
    input: {
      urn: "<urn of the dataset being reported>",
      operationType: INSERT,
      sourceType: DATA_PLATFORM,
      timestampMillis: 1693252366489
    }
  )
}
Use the timestampMillis field to specify the time at which the operation occurred. If no value is provided, the current time will be used.
Tips
Authorization
Remember to always provide a DataHub Personal Access Token when calling the GraphQL API. To do so, just add the 'Authorization' header as follows:
Authorization: Bearer <personal-access-token>
Exploring GraphQL API
Also, remember that you can play with an interactive version of the Acryl GraphQL API at https://your-account-id.acryl.io/api/graphiql
