Custom SQL Assertions
The Custom SQL Assertions feature is available as part of the Acryl Observe module of DataHub Cloud. If you are interested in learning more about Acryl Observe or trying it out, please visit our website.
Introduction
Can you remember a time when the meaning of Data Warehouse Table that you depended on fundamentally changed, with little or no notice? If the answer is yes, how did you find out? We'll take a guess - someone looking at an internal reporting dashboard or worse, a user using your your product, sounded an alarm when a number looked a bit out of the ordinary. Perhaps your table initially tracked purchases made on your company's e-commerce web store, but suddenly began to include purchases made through your company's new mobile app.
There are many reasons why an important Table on Snowflake, Redshift, BigQuery, or Databricks may change in its meaning - application code bugs, new feature rollouts, changes to key metric definitions, etc. Often times, these changes break important assumptions made about the data used in building key downstream data products like reporting dashboards or data-driven product features.
What if you could reduce the time to detect these incidents, so that the people responsible for the data were made aware of data issues before anyone else? With DataHub Cloud Custom SQL Assertions, you can.
DataHub Cloud allows users to define complex expectations about a particular warehouse Table through custom SQL queries, and then monitor those expectations over time as the table grows and changes.
In this article, we'll cover the basics of monitoring Custom SQL Assertions - what they are, how to configure them, and more - so that you and your team can start building trust in your most important data assets.
Let's get started!
Support
Custom SQL Assertions are currently supported for:
- Snowflake
- Redshift
- BigQuery
- Databricks
Note that an Ingestion Source must be configured with the data platform of your choice in DataHub Cloud's Ingestion tab.
Note that SQL Assertions are not yet supported if you are connecting to your warehouse using the DataHub CLI.
What is a Custom SQL Assertion?
A Custom SQL Assertion is a highly configurable Data Quality rule used to monitor a Data Warehouse Table for unexpected or sudden changes in its meaning. Custom SQL Assertions are defined through a raw SQL query that is evaluated against the Table. You have full control over the SQL query, and can use any SQL features supported by your Data Warehouse. Custom SQL Assertions can be particularly useful when you have complex tables or relationships that are used to generate important metrics or reports, and where the meaning of the table is expected to be stable over time. If you have existing SQL queries that you already use to monitor your data, you may find that Custom SQL Assertions are an easy way to port them to DataHub Cloud to get started.
For example, imagine that you have a Table that tracks the number of purchases made on your company's e-commerce web store. You have a SQL query that you use to calculate the number of purchases made in the past 24 hours, and you'd like to monitor this metric over time to ensure that it is always greater than 1000. You can use a Custom SQL Assertion to do this!
Anatomy of a Custom SQL Assertion
At the most basic level, Custom SQL Assertions consist of a few important parts:
- An Evaluation Schedule
- A Query
- A Condition Type
In this section, we'll give an overview of each.
1. Evaluation Schedule
The Evaluation Schedule: This defines how often to query the given warehouse Table. This should usually be configured to match the expected change frequency of the Table, although it can also be less frequently depending on the requirements. You can also specify specific days of the week, hours in the day, or even minutes in an hour.
2. Query
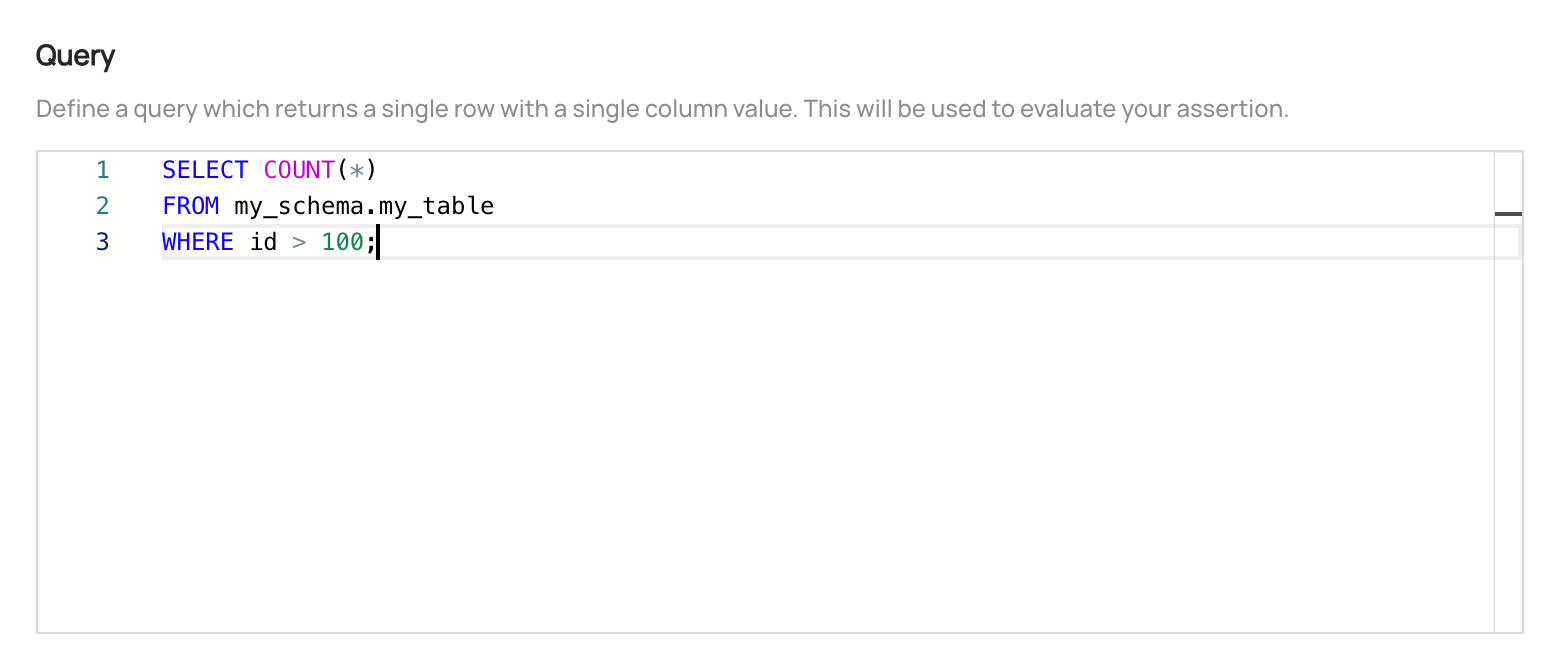
The Query: This is the SQL query that will be used to evaluate the Table. The query should return a single row containing a single numeric column (integers, floats). The query can be as simple or as complex as you'd like, and can use any SQL features supported by your Data Warehouse. This requires that the configured user account has read access to the asset. Make sure to use the fully qualified name of the Table in your query.
Use the "Try it out" button to test your query and ensure that it returns a single row with a single column. The query will be run against the Table in the context of the configured user account, so ensure that the user has read access to the Table.
3. Condition Type
The Condition Type: This defines the conditions under which the Assertion will fail. The list of supported operations is:
- Is Equal To: The assertion will fail if the query result is equal to the configured value
- Is Not Equal To: The assertion will fail if the query result is not equal to the configured value
- Is Greater Than: The assertion will fail if the query result is greater than the configured value
- Is Less Than: The assertion will fail if the query result is less than the configured value
- Is Outside a Range: The assertion will fail if the query result is outside the configured range
- Grows More Than: The assertion will fail if the query result grows more than the configured range. This can be either a percentage (Percentage) or a number (Value).
- Grows Less Than: The assertion will fail if the query result grows less than the configured percentage. This can be either a percentage (Percentage) or a number (Value).
- Growth is outside a range: The assertion will fail if the query result growth is outside the configured range. This can be either a percentage (Percentage) or a number (Value).
Custom SQL Assertions also have an off switch: they can be started or stopped at any time with the click of button.
Creating a Custom SQL Assertion
Prerequisites
Permissions: To create or delete Custom SQL Assertions for a specific entity on DataHub, you'll need to be granted the
Edit Assertions,Edit Monitors, and the additionalEdit SQL Assertion Monitorsprivileges for the entity. This will be granted to Entity owners as part of theAsset Owners - Metadata Policyby default.Data Platform Connection: In order to create a Custom SQL Assertion, you'll need to have an Ingestion Source configured to your Data Platform: Snowflake, BigQuery, Redshift, or Databricks under the Integrations tab.
Once these are in place, you're ready to create your Custom SQL Assertions!
Steps
- Navigate to the Table you want to monitor
- Click the Validations tab
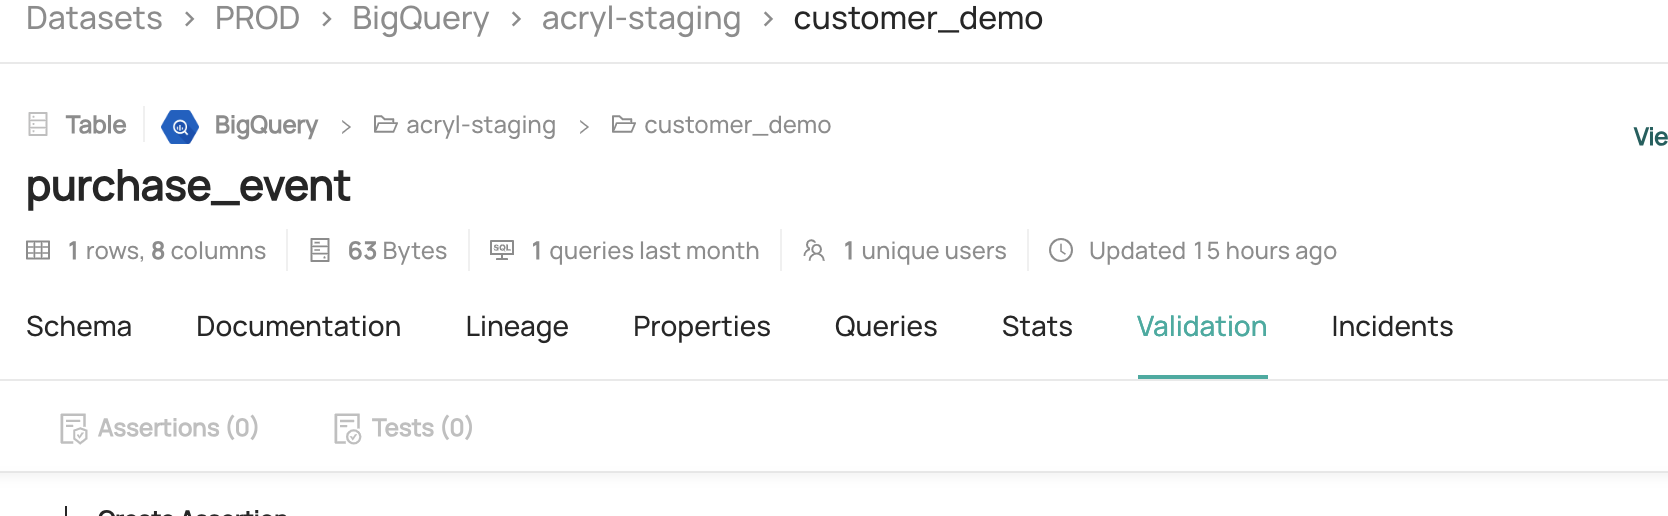
- Click + Create Assertion
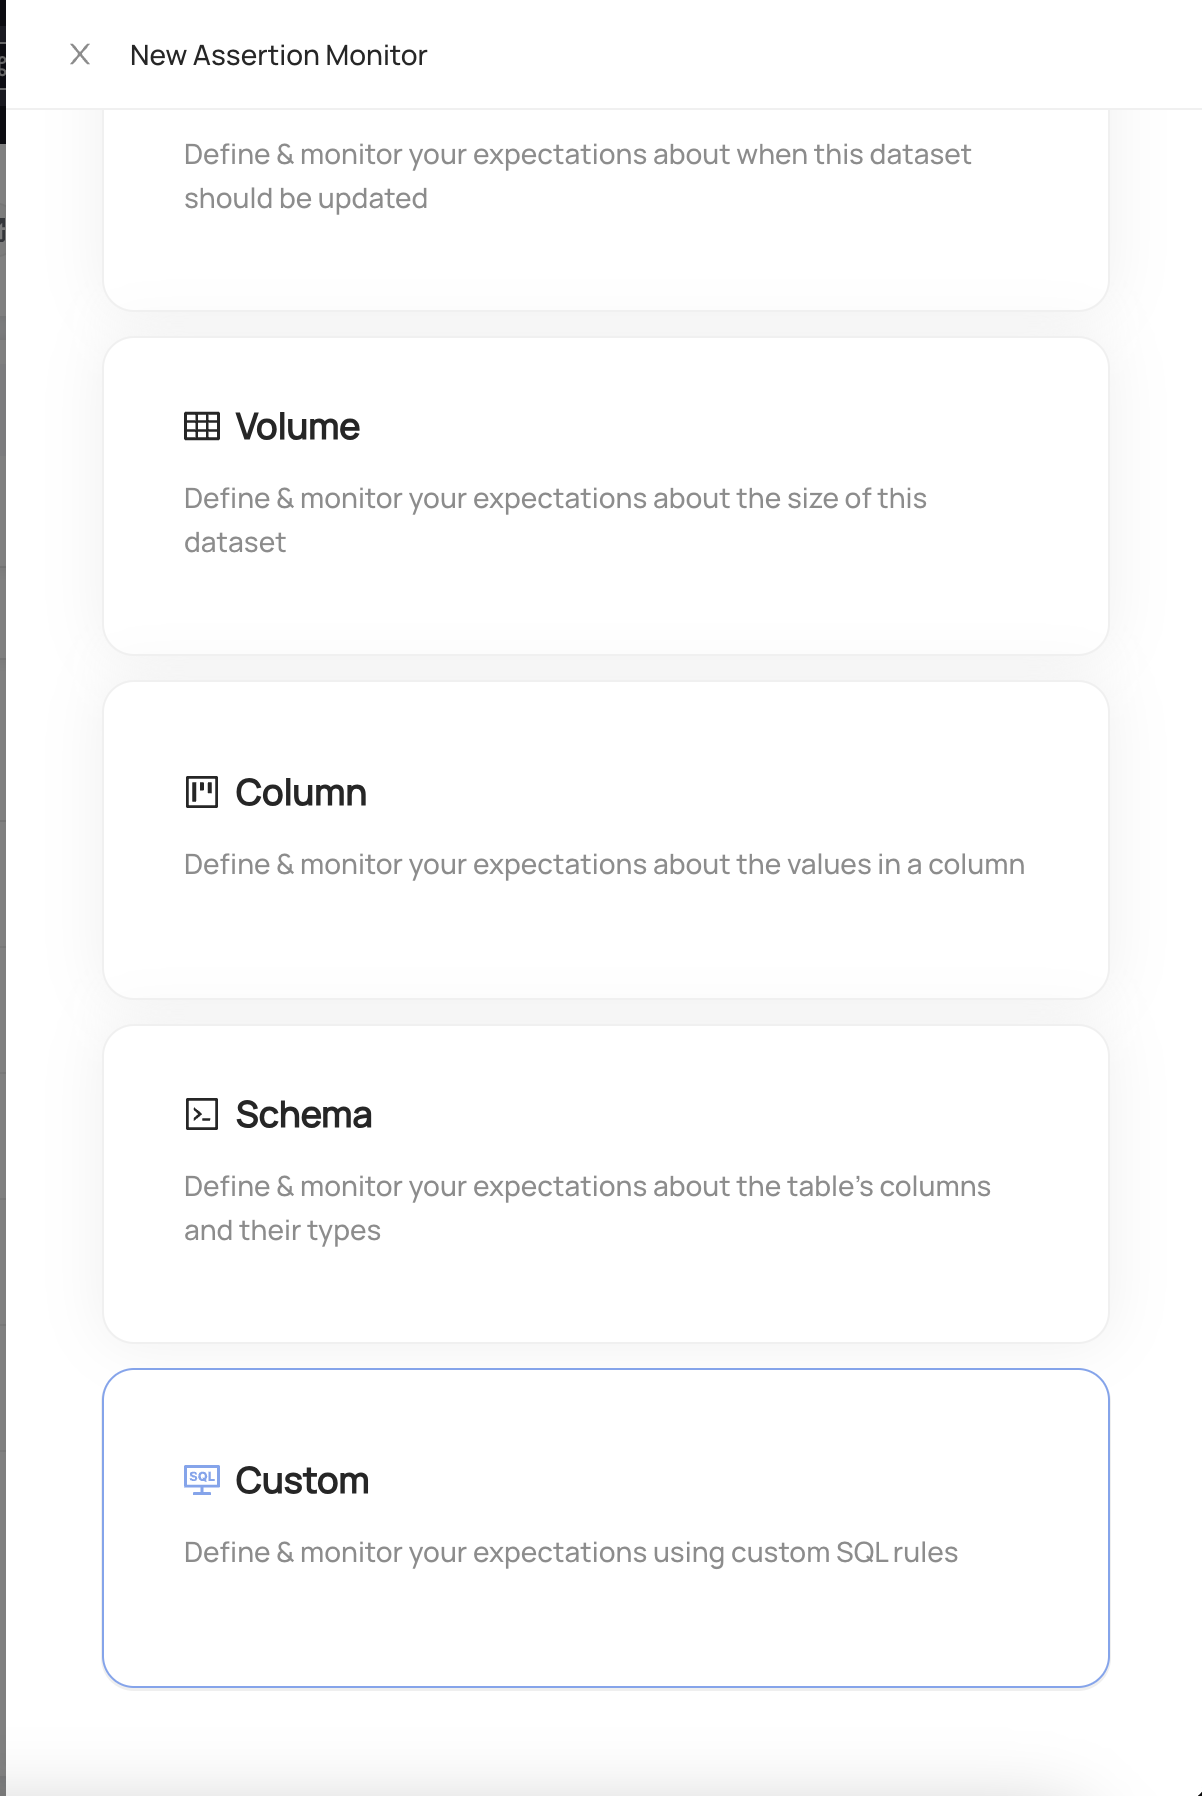
Choose Custom
Configure the evaluation schedule. This is the frequency at which the assertion will be evaluated to produce a pass or fail result, and the times when the query will be executed.
Provide a SQL query that will be used to evaluate the Table. The query should return a single row with a single column. Currently only numeric values are supported (integer and floats). The query can be as simple or as complex as you'd like, and can use any SQL features supported by your Data Warehouse. Make sure to use the fully qualified name of the Table in your query.
- Configure the evaluation condition type. This determines the cases in which the new assertion will fail when it is evaluated.

- Configure actions that should be taken when the Custom SQL Assertion passes or fails
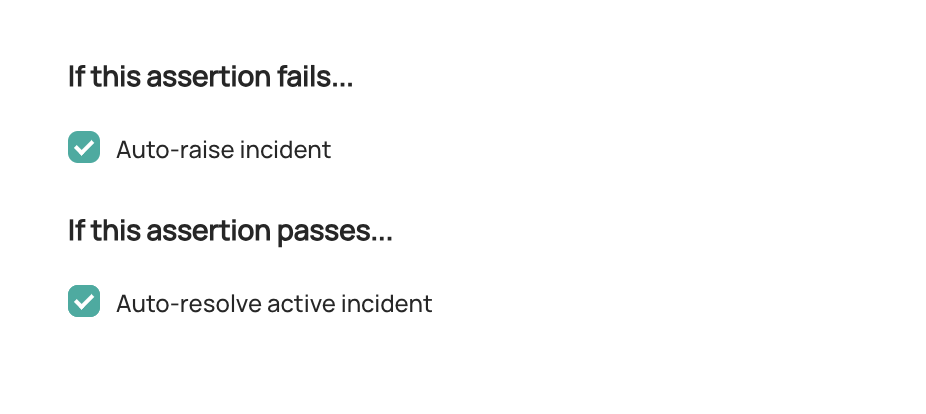
Raise incident: Automatically raise a new DataHub Incident for the Table whenever the Custom SQL Assertion is failing. This may indicate that the Table is unfit for consumption. Configure Slack Notifications under Settings to be notified when an incident is created due to an Assertion failure.
Resolve incident: Automatically resolved any incidents that were raised due to failures in this Custom SQL Assertion. Note that any other incidents will not be impacted.
- (Optional) Use the Try it out button to test your query and ensure that it returns a single row with a single column, and passes the configured condition type.

Click Next and then add a description.
Click Save
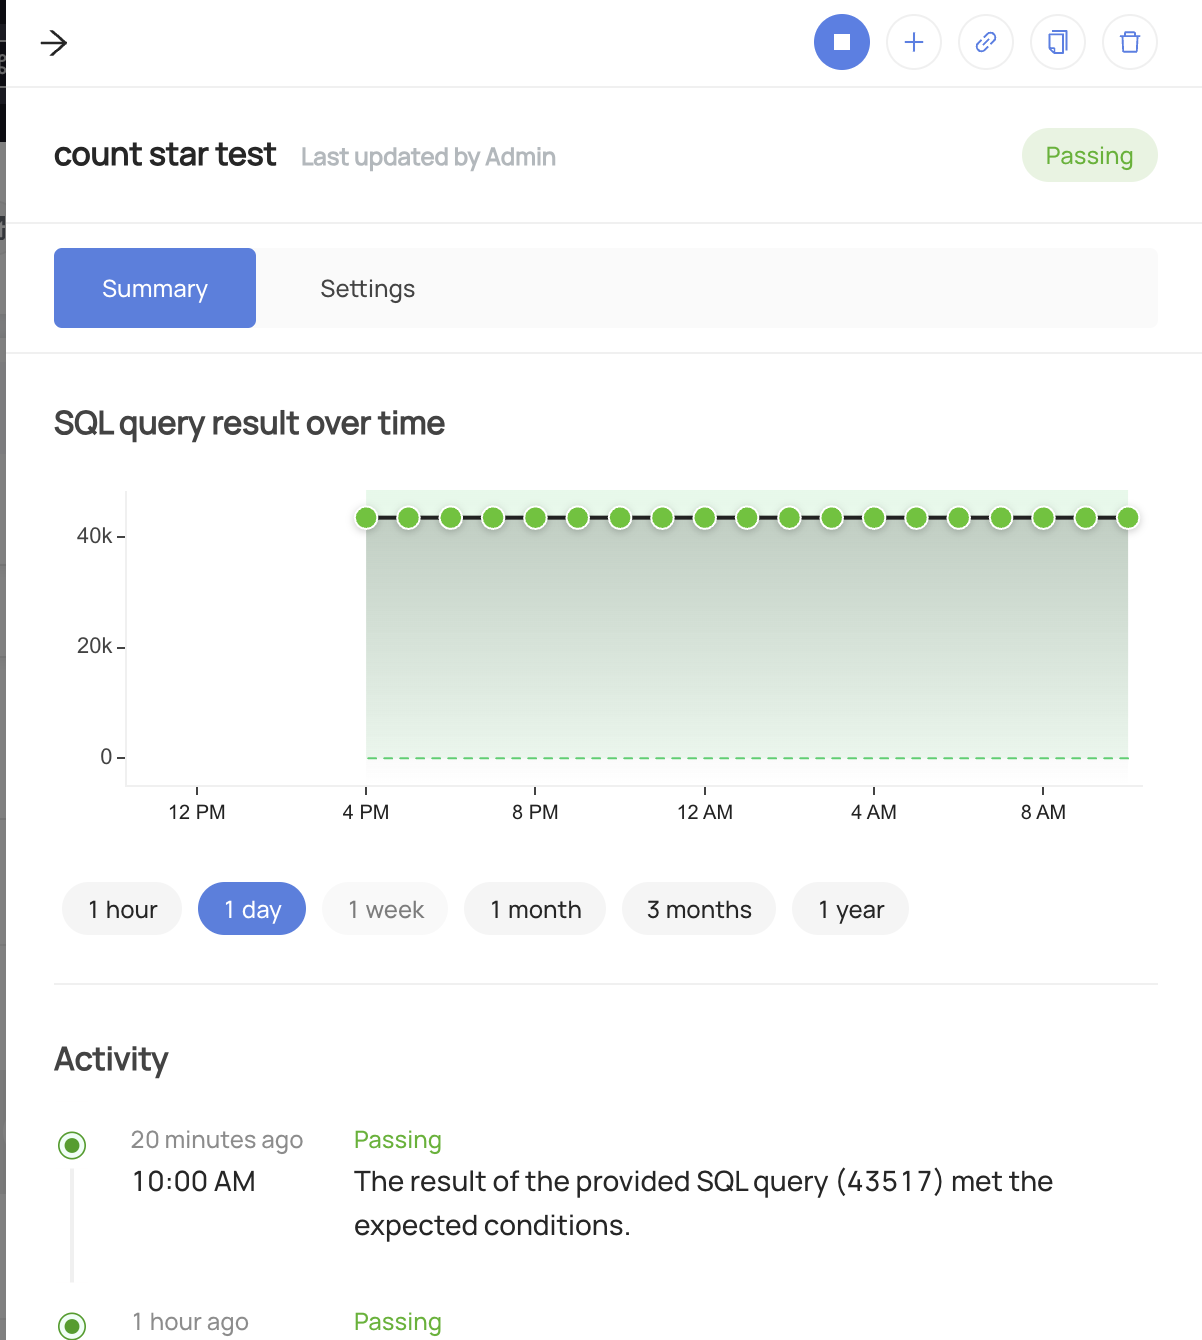
And that's it! DataHub will now begin to monitor your Custom SQL Assertion for the table.
Once your assertion has run, you will begin to see Success or Failure status for the Table
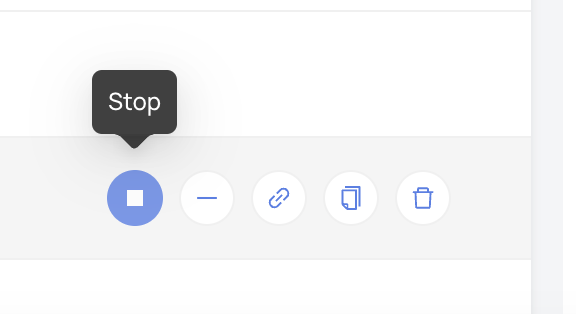
Stopping a Custom SQL Assertion
In order to temporarily stop the evaluation of the assertion:
- Navigate to the Validations tab of the Table with the assertion
- Click Custom SQL to open the SQL Assertion assertions
- Click the "Stop" button for the assertion you wish to pause.
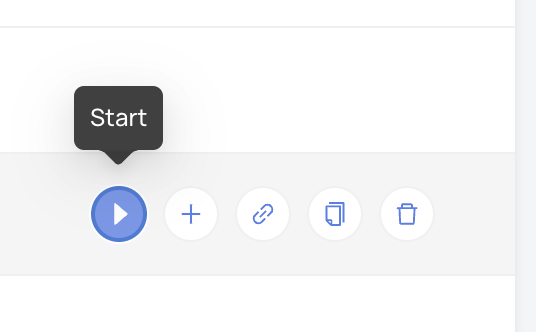
To resume the assertion, simply click Start.
Creating Custom SQL Assertions via API
Under the hood, DataHub Cloud implements Custom SQL Assertion Monitoring using two concepts:
Assertion: The specific expectation for the custom assertion, e.g. "The table was changed in the past 7 hours" or "The table is changed on a schedule of every day by 8am". This is the "what".
Monitor: The process responsible for evaluating the Assertion on a given evaluation schedule and using specific mechanisms. This is the "how".
Note that to create or delete Assertions and Monitors for a specific entity on DataHub, you'll need the
Edit Assertions and Edit Monitors privileges for it.
GraphQL
In order to create or update a Custom SQL Assertion, you can use the upsertDatasetSqlAssertionMonitor mutation.
Examples
To create a Custom SQL Assertion Entity that checks whether a query result is greater than 100 that runs every 8 hours:
mutation upsertDatasetSqlAssertionMonitor {
  upsertDatasetSqlAssertionMonitor(
    input: {
      entityUrn: "<urn of entity being monitored>"
      type: METRIC,
      description: "<description of the custom assertion>",
      statement: "<SQL query to be evaluated>",
      operator: GREATER_THAN_OR_EQUAL_TO,
      parameters: {
        value: {
          value: "100",
          type: NUMBER
        }
      }
      evaluationSchedule: {
        timezone: "America/Los_Angeles"
        cron: "0 */8 * * *"
      }
      mode: ACTIVE
    }
  ) {
    urn
  }
}
You can use same endpoint with assertion urn input to update an existing Custom SQL Assertion and corresponding Monitor.
mutation upsertDatasetSqlAssertionMonitor {
  upsertDatasetSqlAssertionMonitor(
    assertionUrn: "<urn of assertion created in earlier query>"
    input: {
      entityUrn: "<urn of entity being monitored>"
      type: METRIC,
      description: "<description of the custom assertion>",
      statement: "<SQL query to be evaluated>",
      operator: GREATER_THAN_OR_EQUAL_TO,
      parameters: {
        value: {
          value: "100",
          type: NUMBER
        }
      }
      evaluationSchedule: {
        timezone: "America/Los_Angeles"
        cron: "0 */6 * * *"
      }
      mode: ACTIVE
    }
  ) {
    urn
  }
}
You can delete assertions along with their monitors using GraphQL mutations: deleteAssertion and deleteMonitor.
Tips
Authorization
Remember to always provide a DataHub Personal Access Token when calling the GraphQL API. To do so, just add the 'Authorization' header as follows:
Authorization: Bearer <personal-access-token>
Exploring GraphQL API
Also, remember that you can play with an interactive version of the Acryl GraphQL API at https://your-account-id.acryl.io/api/graphiql