Profiling ingestions
🤝 Version compatibility
Open Source DataHub: 0.11.1 | Acryl: 0.2.12
This page documents how to perform memory profiles of ingestion runs. It is useful when trying to size the amount of resources necessary to ingest some source or when developing new features or sources.
How to use
- UI
- CLI
Create an ingestion as specified in the Ingestion guide.
Add a flag to your ingestion recipe to generate a memray memory dump of your ingestion:
source:
  ...

sink:
  ...

flags:
  generate_memory_profiles: "<path to folder where dumps will be written to>"
In the final panel, under the advanced section, add the debug datahub package under the Extra DataHub Plugins section.
As seen below:
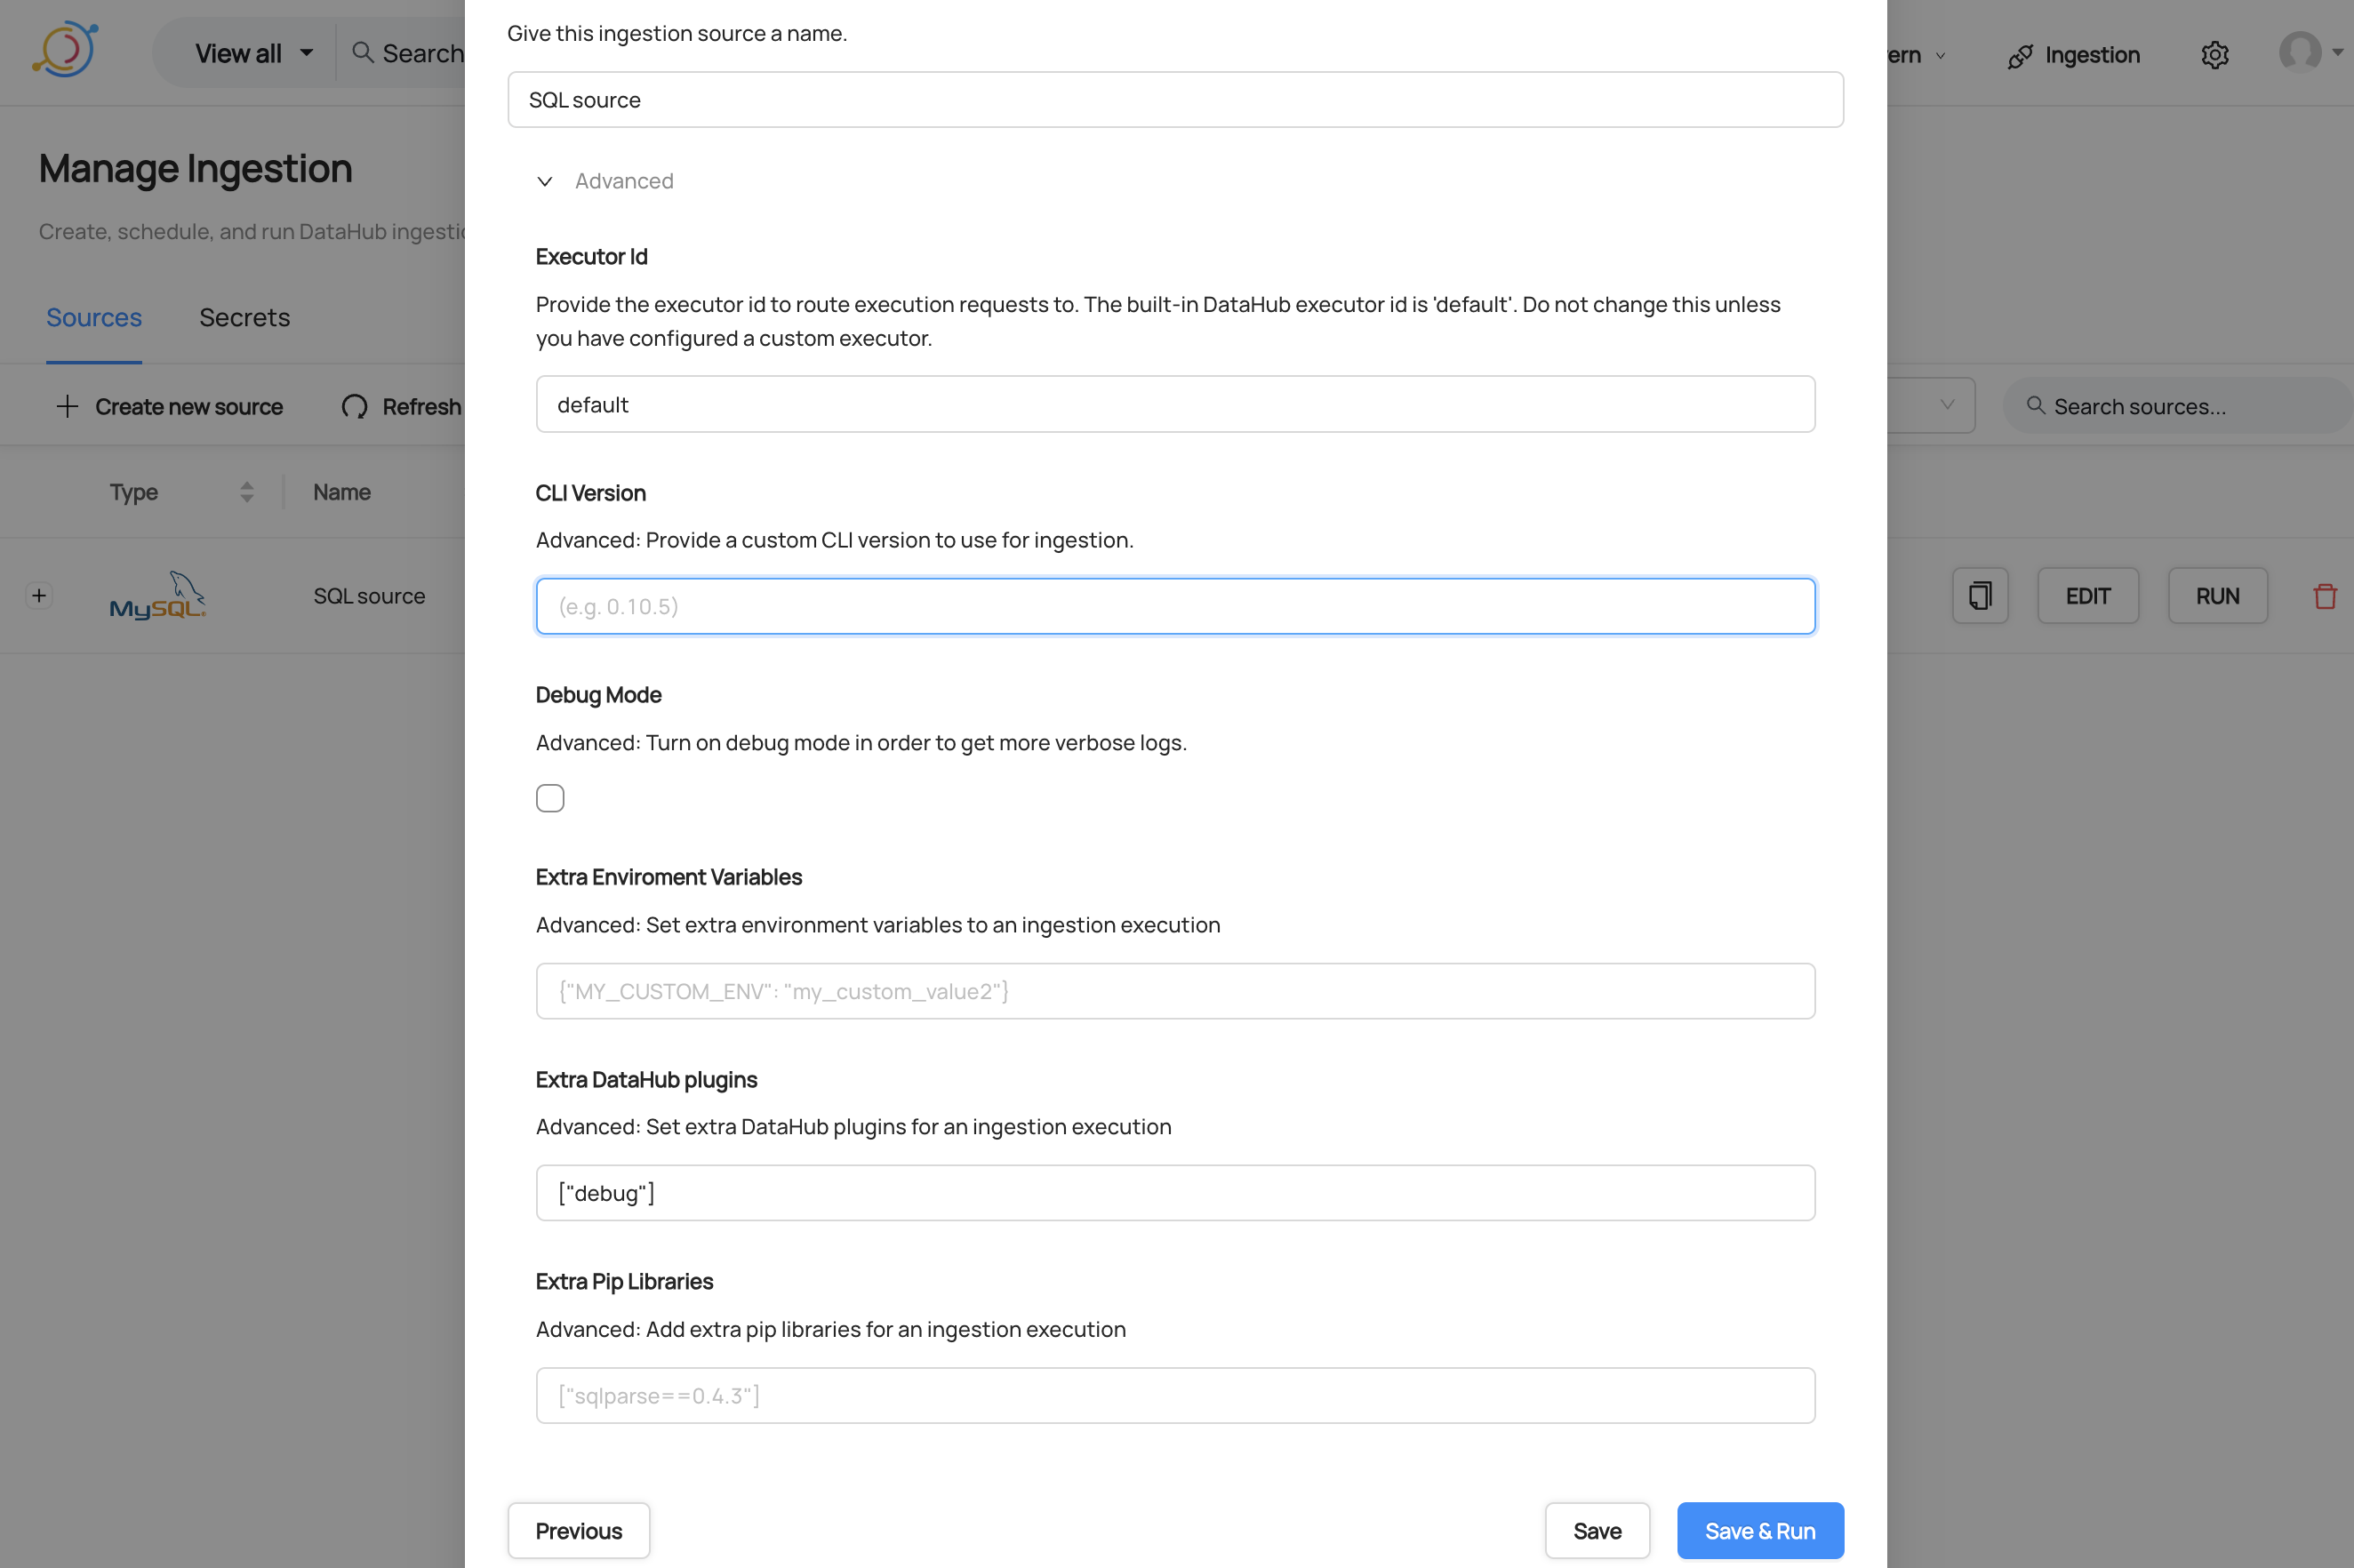
Finally, save and run the ingestion process.
pip install 'acryl-datahub[debug]'
This will install memray in your python environment.
Add a flag to your ingestion recipe to generate a memray memory dump of your ingestion:
source:
  ...

sink:
  ...

flags:
  generate_memory_profiles: "<path to folder where dumps will be written to>"
Finally run the ingestion recipe
$ datahub ingest -c recipe.yaml
Once the ingestion run starts a binary file will be created and appended to during the execution of the ingestion.
These files follow the pattern file-<ingestion-run-urn>.bin for a unique identification.
Once the ingestion has finished you can use memray to analyze the memory dump in a flamegraph view using:
$ memray flamegraph file-None-file-2023_09_18-21_38_43.bin
This will generate an interactive HTML file for analysis:

memray has an extensive set of features for memory investigation. Take a look at their documentation to see the full feature set.
Questions
If you've got any questions on configuring profiling, feel free to ping us on our Slack!